Service Mesh Visibility
In order to be able see and monitor all of our application calls we will need to connect to the Grafana and Zipkin services
- Get the svc external ip
kubectl get svc zipkin -n zipkin
Output
-
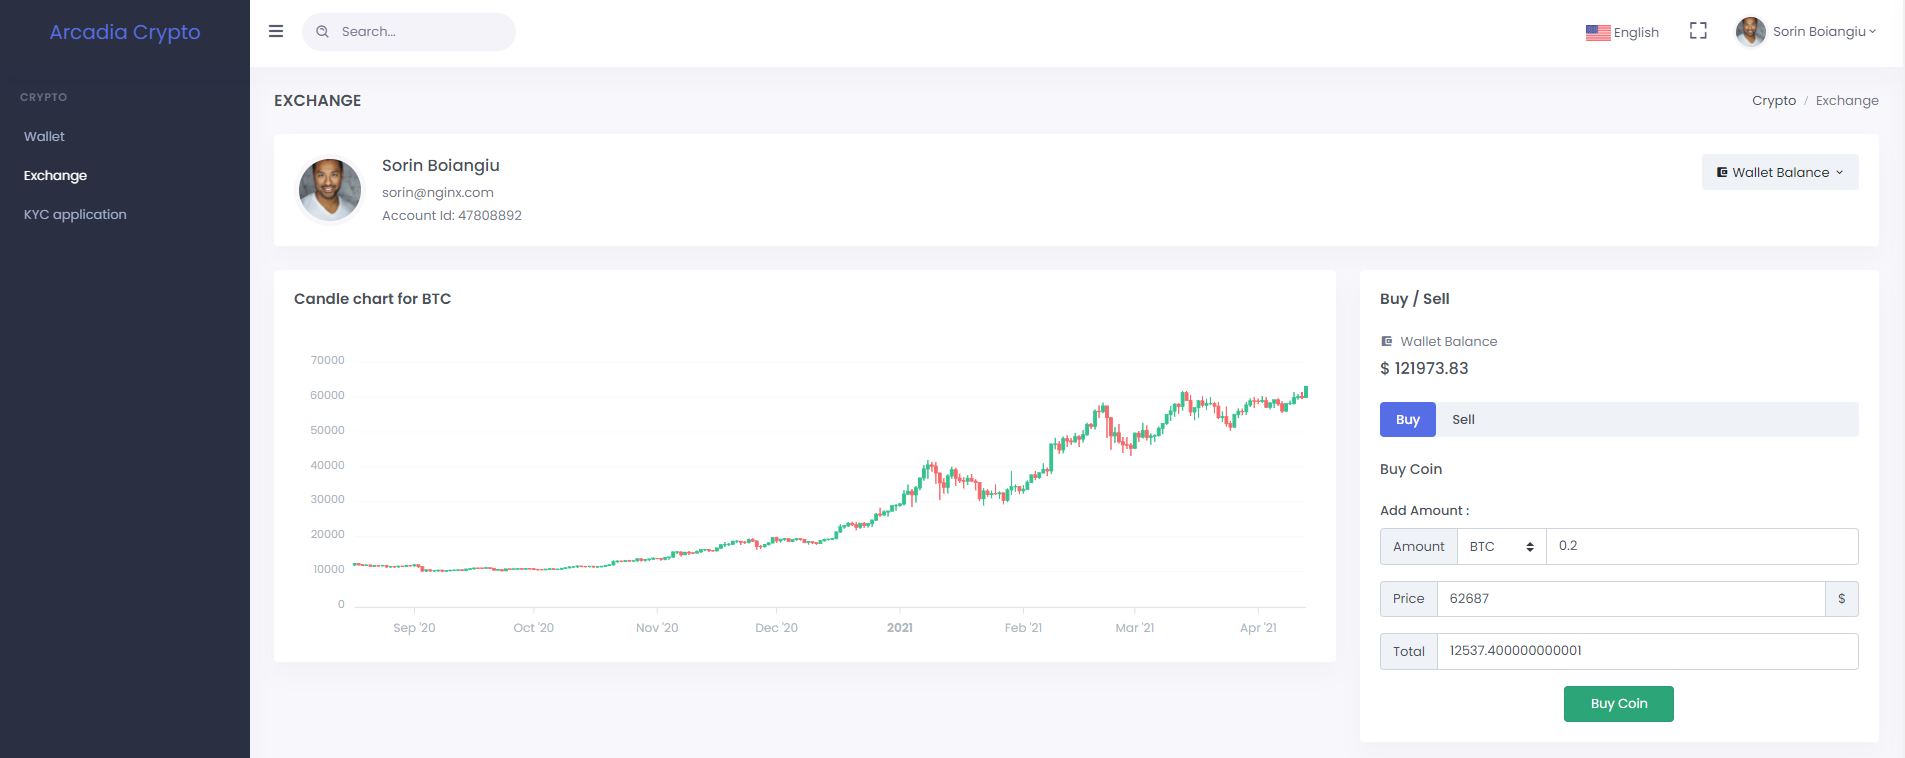
Go and buy or sell crypto coin. We will use Zipkin to trace this operation through the different services.
-
Browse to the Zipkin dashboard
http://<ZIPKIN-EXTERNAL-IP>:9411Create a filter as in the bellow image. Click on the result that looks like the first entry.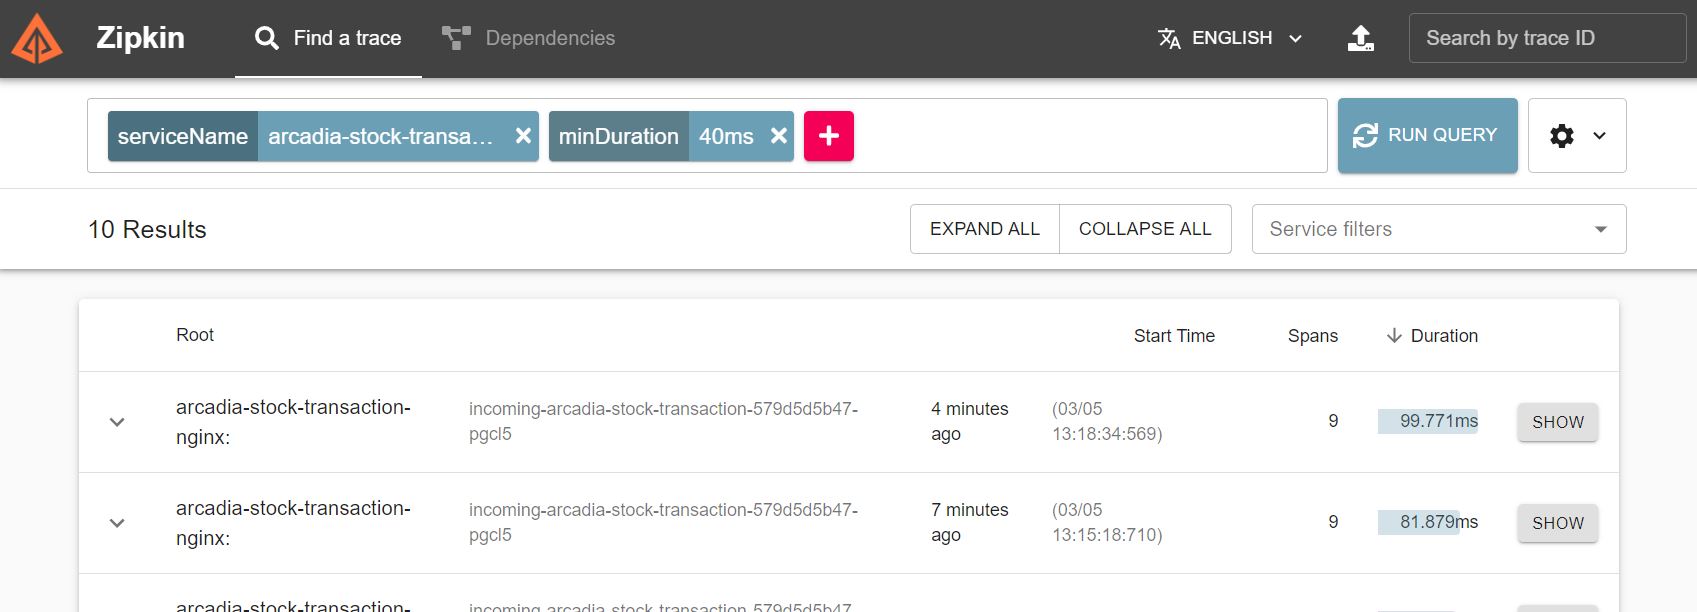
-
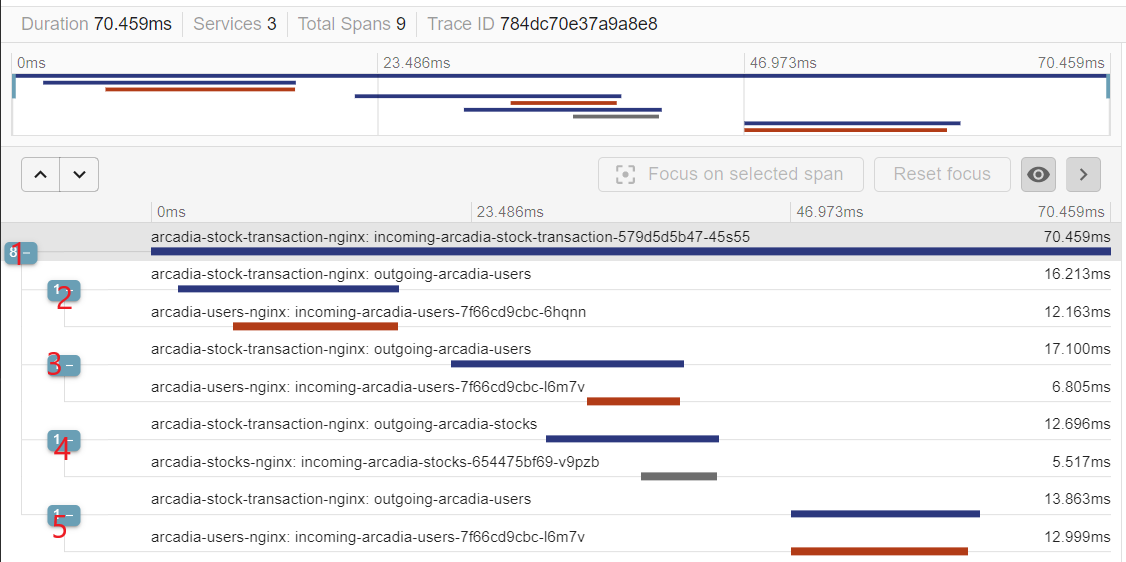
When buy or selling crypto the HTTP from the browser is sent to the application.
1 - We see the transaction coming from the user and processed by the stock transaction service
2 - The stock transaction service contacts the user service in order to translate the user email address to the account id
3 and 4 - Next will again contact the users service to get the account information ( balance and crypto currencies), the stocks service to get the current buy and sell prices.
Once the operation has been validated and approved it will be recorded in the database and a success response returned to the client.
5 - The stock transaction service updates the user service in order to update the users balance